AI, Productivity, Education
Autoplot
Scientific data analysis and plotting for Mac
About Autoplot
Unify raw data processing, statistical analysis, and figure creation within a single native macOS workspace. Perform heavy-tail distribution fits, automated finite-size scaling, surface plots, and interactive 3D visualizations directly on your Mac. The built-in assistant generates and executes Python code locally, keeping underlying values private while helping you turn raw files into publication-ready figures for academic journals.
Who is Autoplot for?
Scientists, academic researchers, and laboratory analysts who currently jump between command-line Python scripts, spreadsheet tools, and vector graphics editors to analyze data and format paper submissions. It provides a cohesive desktop environment for those who need rigorous, reproducible data fitting alongside journal-compliant figure generation.
How does Autoplot work?
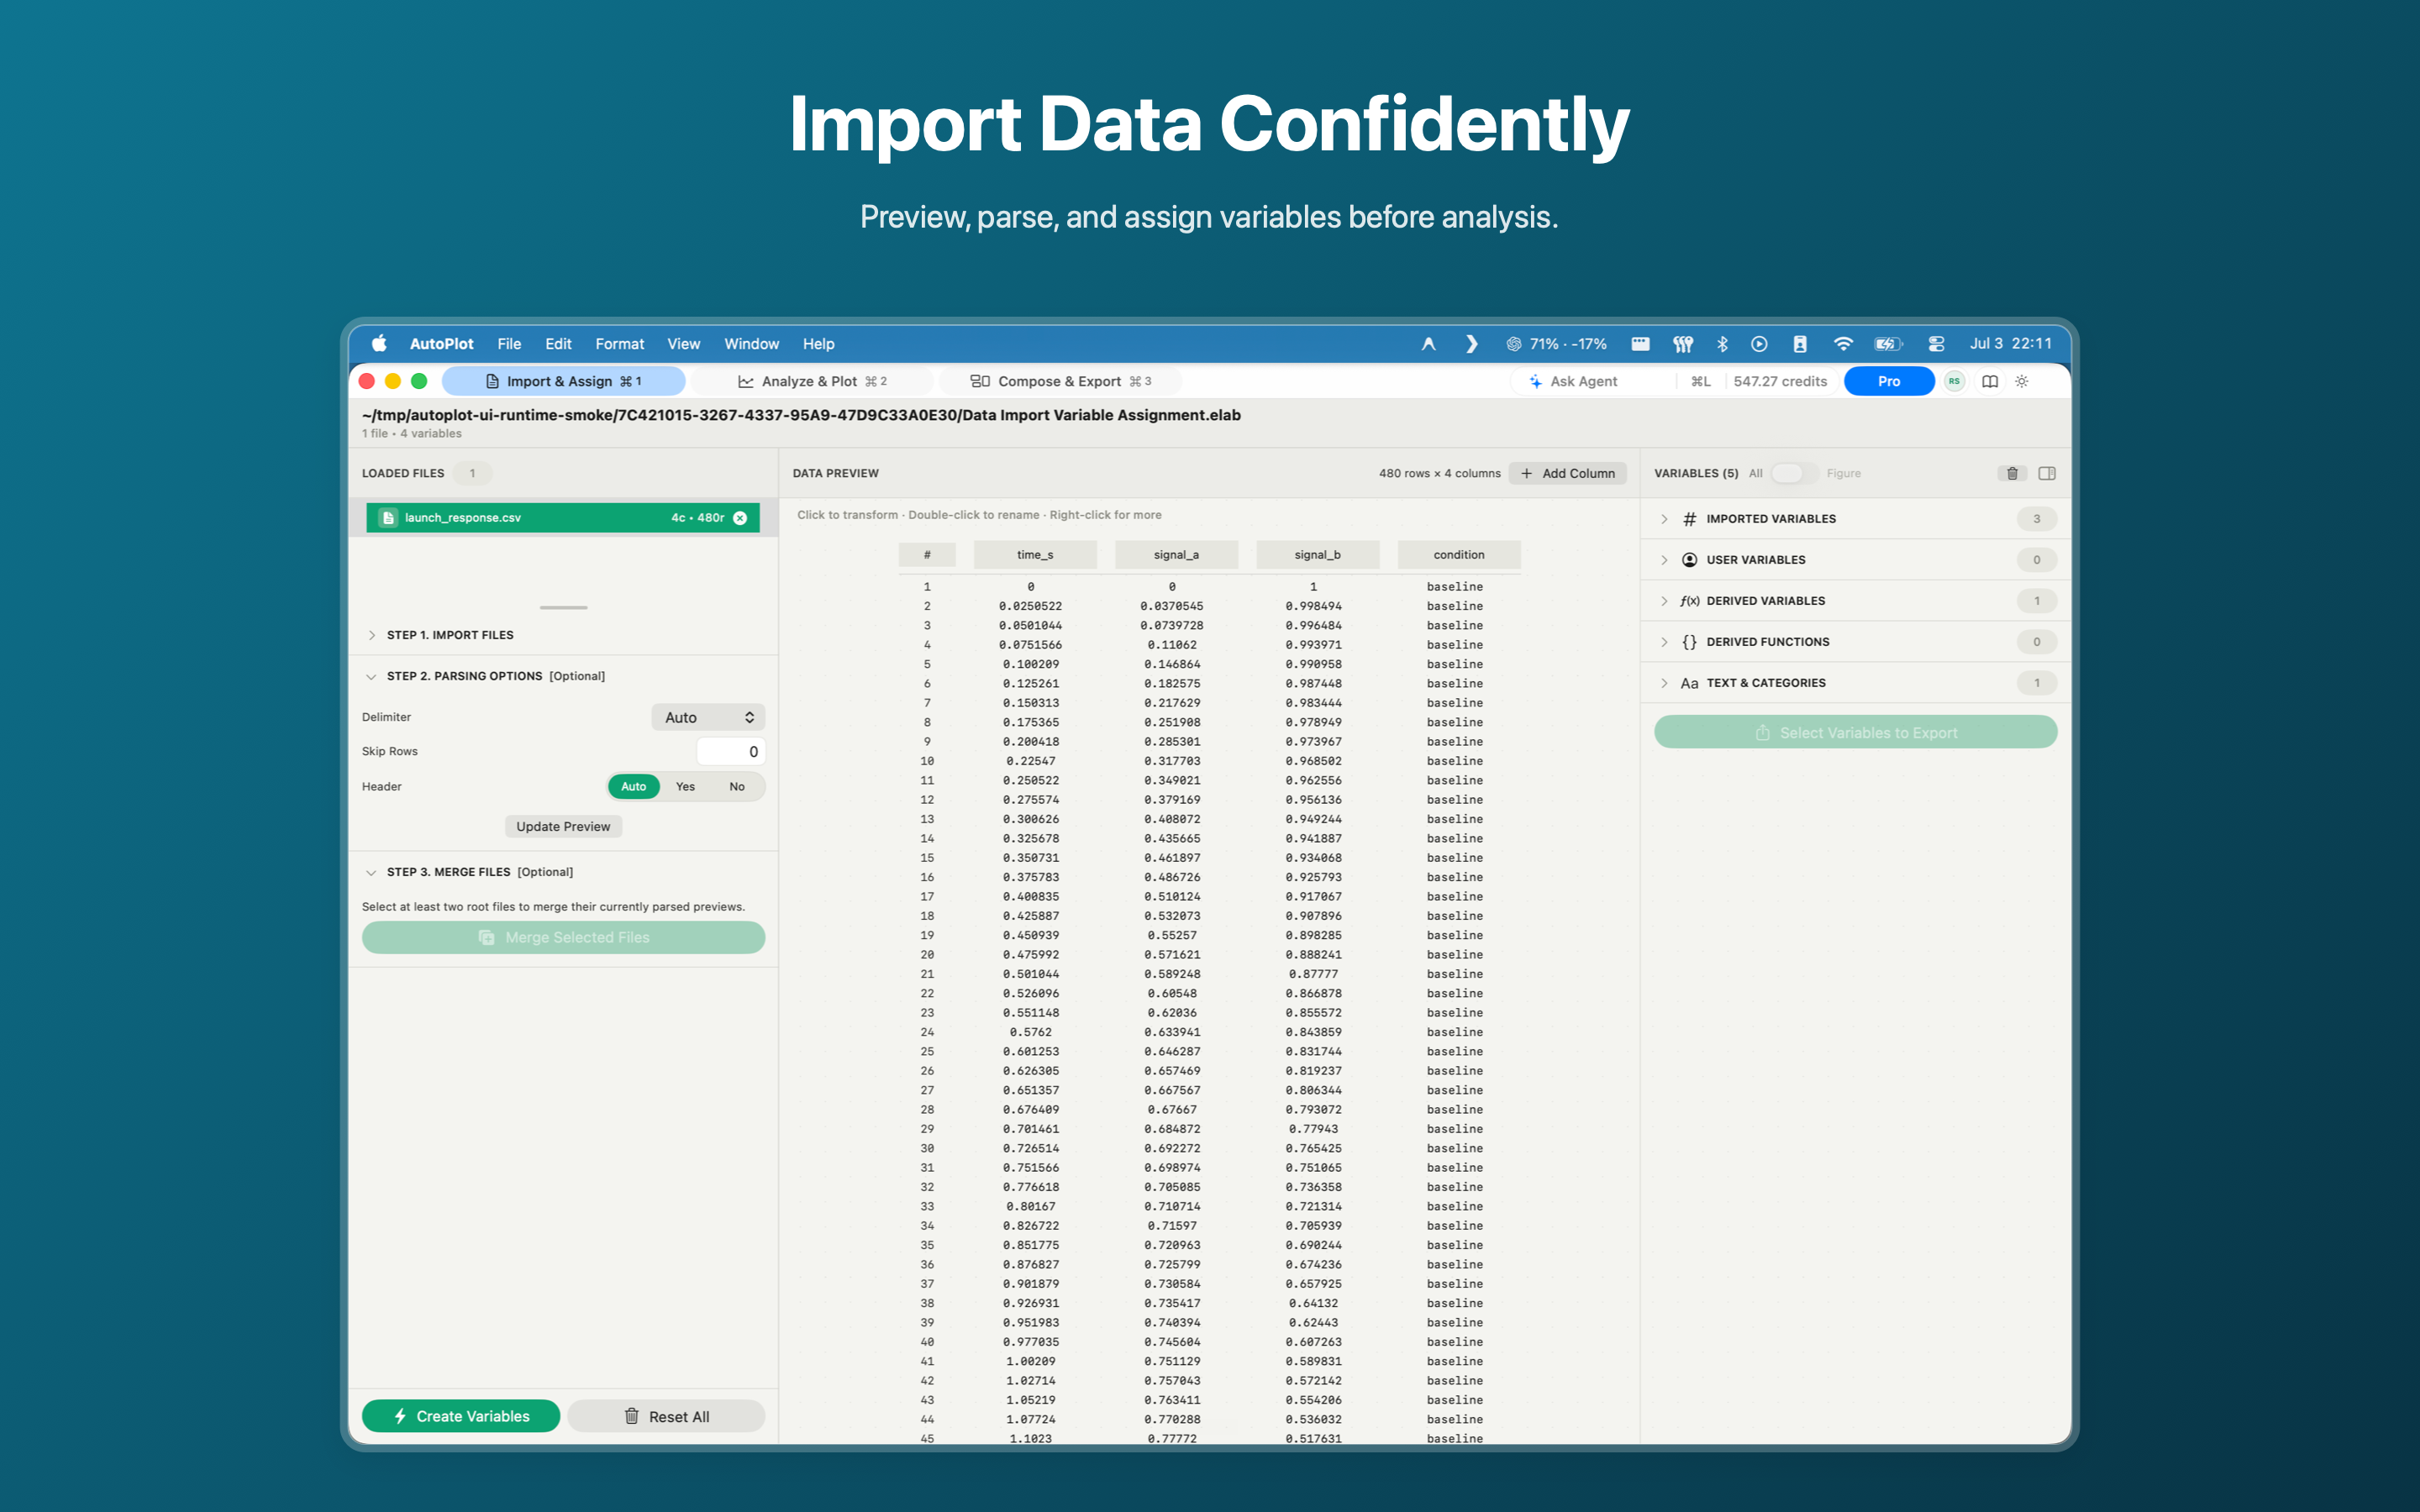
Drop local raw data files or connect via SFTP into the unified project workspace. Run built-in analytical methods or ask the assistant to execute automated Python code locally to generate distribution fits, scaling curves, or Metal-rendered 3D surface plots. Apply exact journal styling presets, customize layout details, and export final high-resolution figures alongside reproducible code.